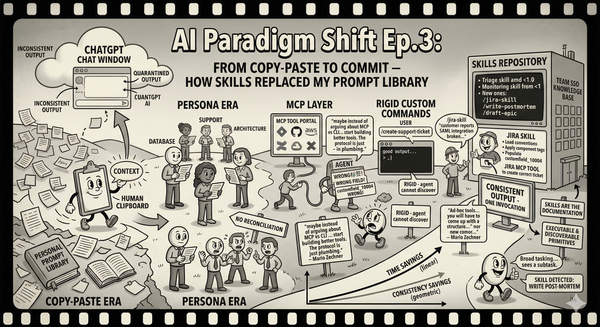
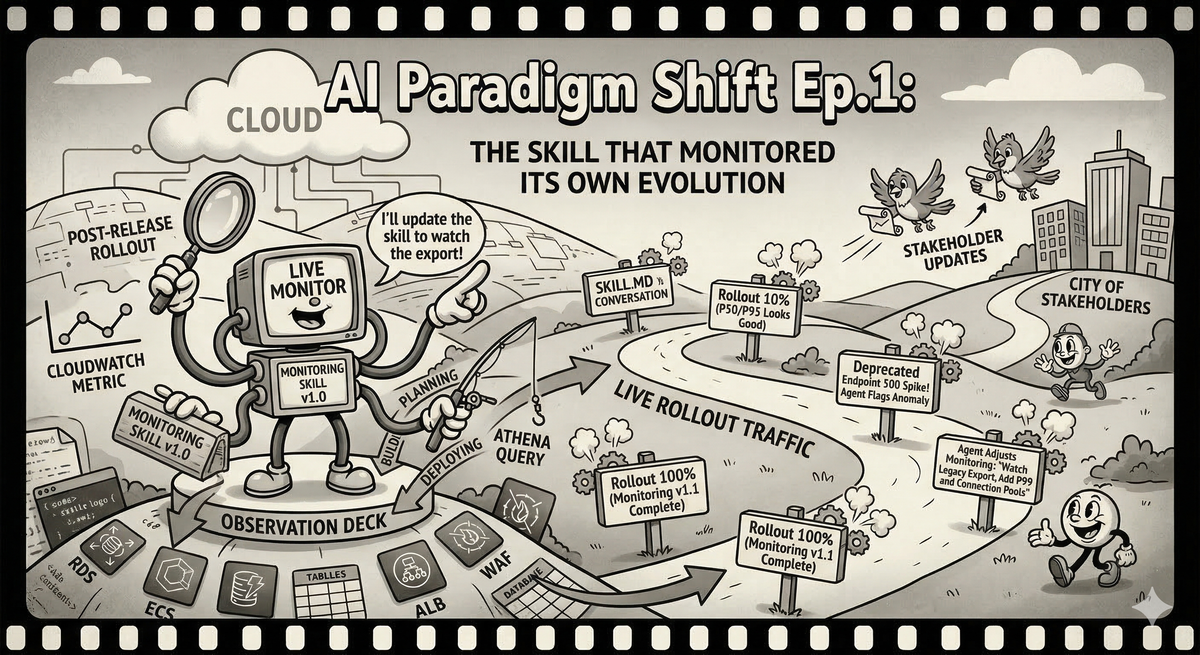
AI Paradigm Shift Ep.1: The Skill That Monitored Its Own Evolution
How building an AI skill for post-release monitoring changed how I think about the entire software development lifecycle.

I lead the SSO team at Ubiquiti. We handle authentication, token management, user provisioning — the kind of infrastructure that every other team depends on and nobody thinks about until it breaks. It is a thankless gig with excellent job security.
A few weeks ago we identified a bottleneck in our email module. Every API that touches email — password resets, MFA verification, invite flows, notification preferences — was slower than it should have been. The fix was straightforward: cache the critical components that the email module initializes on every call.
We were confident the caching layer was correct. Unit tests passed. Integration tests passed. The question was: what happens when we flip this on for real traffic? Every API that imports the email module should get faster. "Should" is the word that has ruined more weekends than any other in the English language.
Time to monitor the rollout.
The Old Way, or: How I Learned to Stop Worrying and Build Dashboards That Nobody Reads
I have done this dance before. Many times. The steps are always the same.
First, you sit down and enumerate every API that could be affected. You open the codebase, grep for email module imports, build a list. You miss two because they go through an internal wrapper that doesn't import the module directly. You will discover this later, at the worst possible time. You don't blame yourself because people left this legacy 10 years ago, but other people sure do blame you when things go south.
Then you write a script. Or you build a CloudWatch dashboard. Or both, because the script gives you the raw data and the dashboard gives you the pretty graphs for the incident channel when someone asks "is everything okay?" and you need to respond with something more convincing than "I think so."
The dashboard has panels for each API's status code distribution, p50 and p95 latency, and request volume. You arrange them neatly. You set reasonable Y-axis ranges. You feel briefly competent.
You deploy.
The first hour looks good. Latencies are down across the board. You send a message to the team channel with a screenshot and a modest celebration emoji. Then someone reports that the legacy user-export endpoint — the one that was deprecated two quarters ago but that three enterprise customers still call because nobody enforced the deprecation — is returning 500s. It turns out the caching layer interacts badly with a code path that passes a mutable config object into the email module and expects the module to modify it as a side effect. The kind of thing you would never design on purpose but that accretes naturally in any codebase older than eighteen months.
Now you are in incident mode. You need data on an API that is not in your dashboard. You SSH into a box. You run ad-hoc queries against the metrics store. You build a mental model from grep output and good intentions. You find the bug, push a fix, verify the fix, and then start the paperwork: incident report, Jira tickets for the deprecated endpoint migration, a post-mortem action item to "improve monitoring coverage." You also need to update your dashboard to include the APIs you missed, because next time — and there is always a next time — you want to see the full picture.
The monitoring was supposed to help you through the release. Instead it became its own project, with its own bugs, its own maintenance burden, and its own technical debt. The dashboard you built is correct as of today. By next quarter, when someone adds a new email-dependent endpoint, it will be incomplete again, and nobody will update it, because nobody ever updates dashboards. They are the fruit flies of infrastructure: brief, prolific, and largely ignored after the first day.
I have lived this cycle a dozen times. I assumed it was just how things worked. The cost of doing business. The developer's version of death and taxes.
The New Way, or: Talking to Your Monitoring
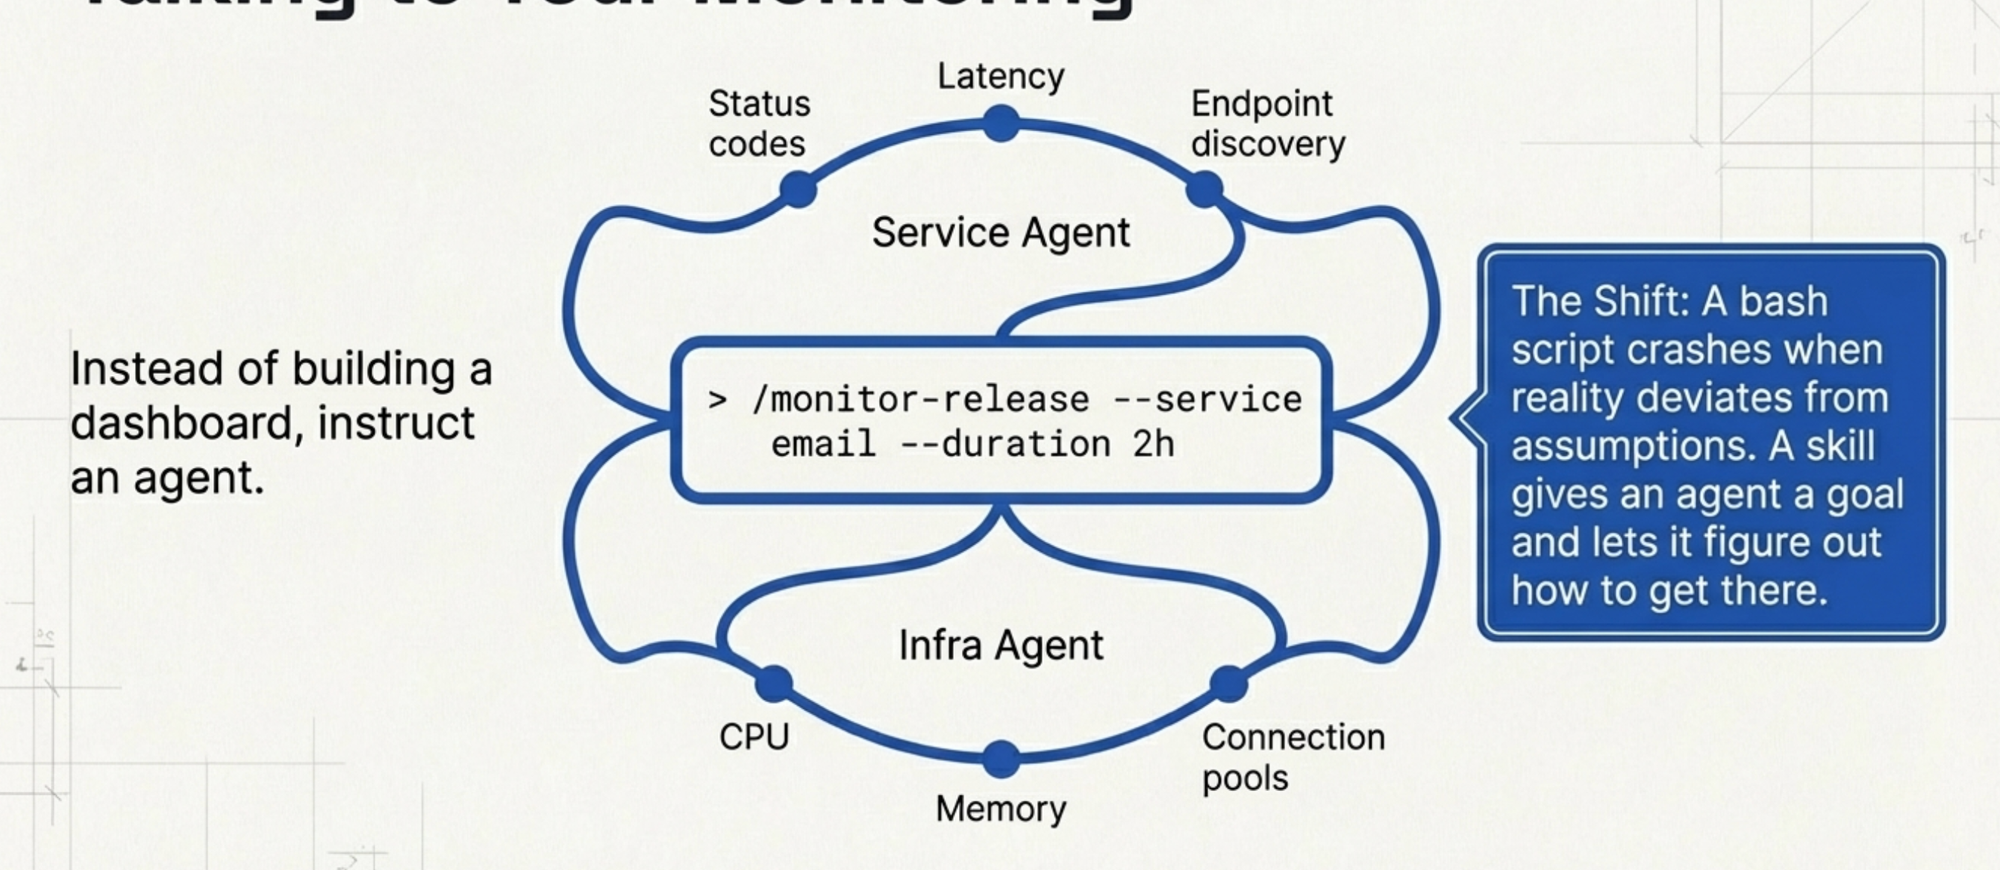
This time I did something different. Instead of writing a script or building a dashboard, I asked Claude Code to build me a skill.
A skill, in Claude Code, is a reusable command — a bundle of instructions and tool definitions that an agent can execute. Think of it as a script that can think. Where a bash script follows a fixed sequence of commands and crashes when reality deviates from the author's assumptions, a skill gives the agent a goal and lets it figure out how to get there.
Here is what I asked for, roughly: "Build a post-release monitoring skill. It should spawn two concurrent agents — one watching service-level metrics like status codes and latency for each API endpoint, and one watching infrastructure-level metrics like CPU, memory, and connection pool utilization. I want to be able to tell it how long to monitor and which service to focus on."
That was it. No enumerating APIs by hand. No designing dashboard layouts. No writing CloudWatch metric queries. The skill understands the monitoring goal, knows how to query our metrics systems, and figures out which endpoints exist by looking at the actual traffic data rather than my incomplete mental model of the codebase.
We wrote a command: /monitor-release --service email --duration 2h. The agent spins up, forks into the two monitoring threads, and starts watching. It gives me a running summary in the terminal. Service agent reports latency changes per endpoint with percentage improvements. Infra agent reports resource utilization trends. Both flag anomalies.
I deployed the caching layer. The skill started doing its job. Latencies dropped. The summary looked clean. I sent the screenshot to the team channel.
Then the legacy user-export endpoint started throwing 500s. Same bug as I would have hit in the old world. Same deprecated API that was not on my radar.
But this time, the monitoring agent noticed. It was not limited to a predefined list of endpoints I had hardcoded into a dashboard. It was watching the actual traffic patterns for the email service, and when an endpoint that had been returning 200s suddenly started returning 500s, it flagged it. I did not have to SSH into anything. I did not have to write an ad-hoc query. The agent told me: "The /v1/users/export endpoint is showing a spike in 500 status codes starting at 14:32 UTC. This endpoint was not in the initial monitoring scope but it imports the email module transitively through UserBulkOperations. Want me to add it to the primary watch list?"
Yes. Yes I do.
When You Can Just Ask for What You Want
Here is where the old way and the new way diverge so completely that calling it an "improvement" undersells it. It is a different lifecycle.
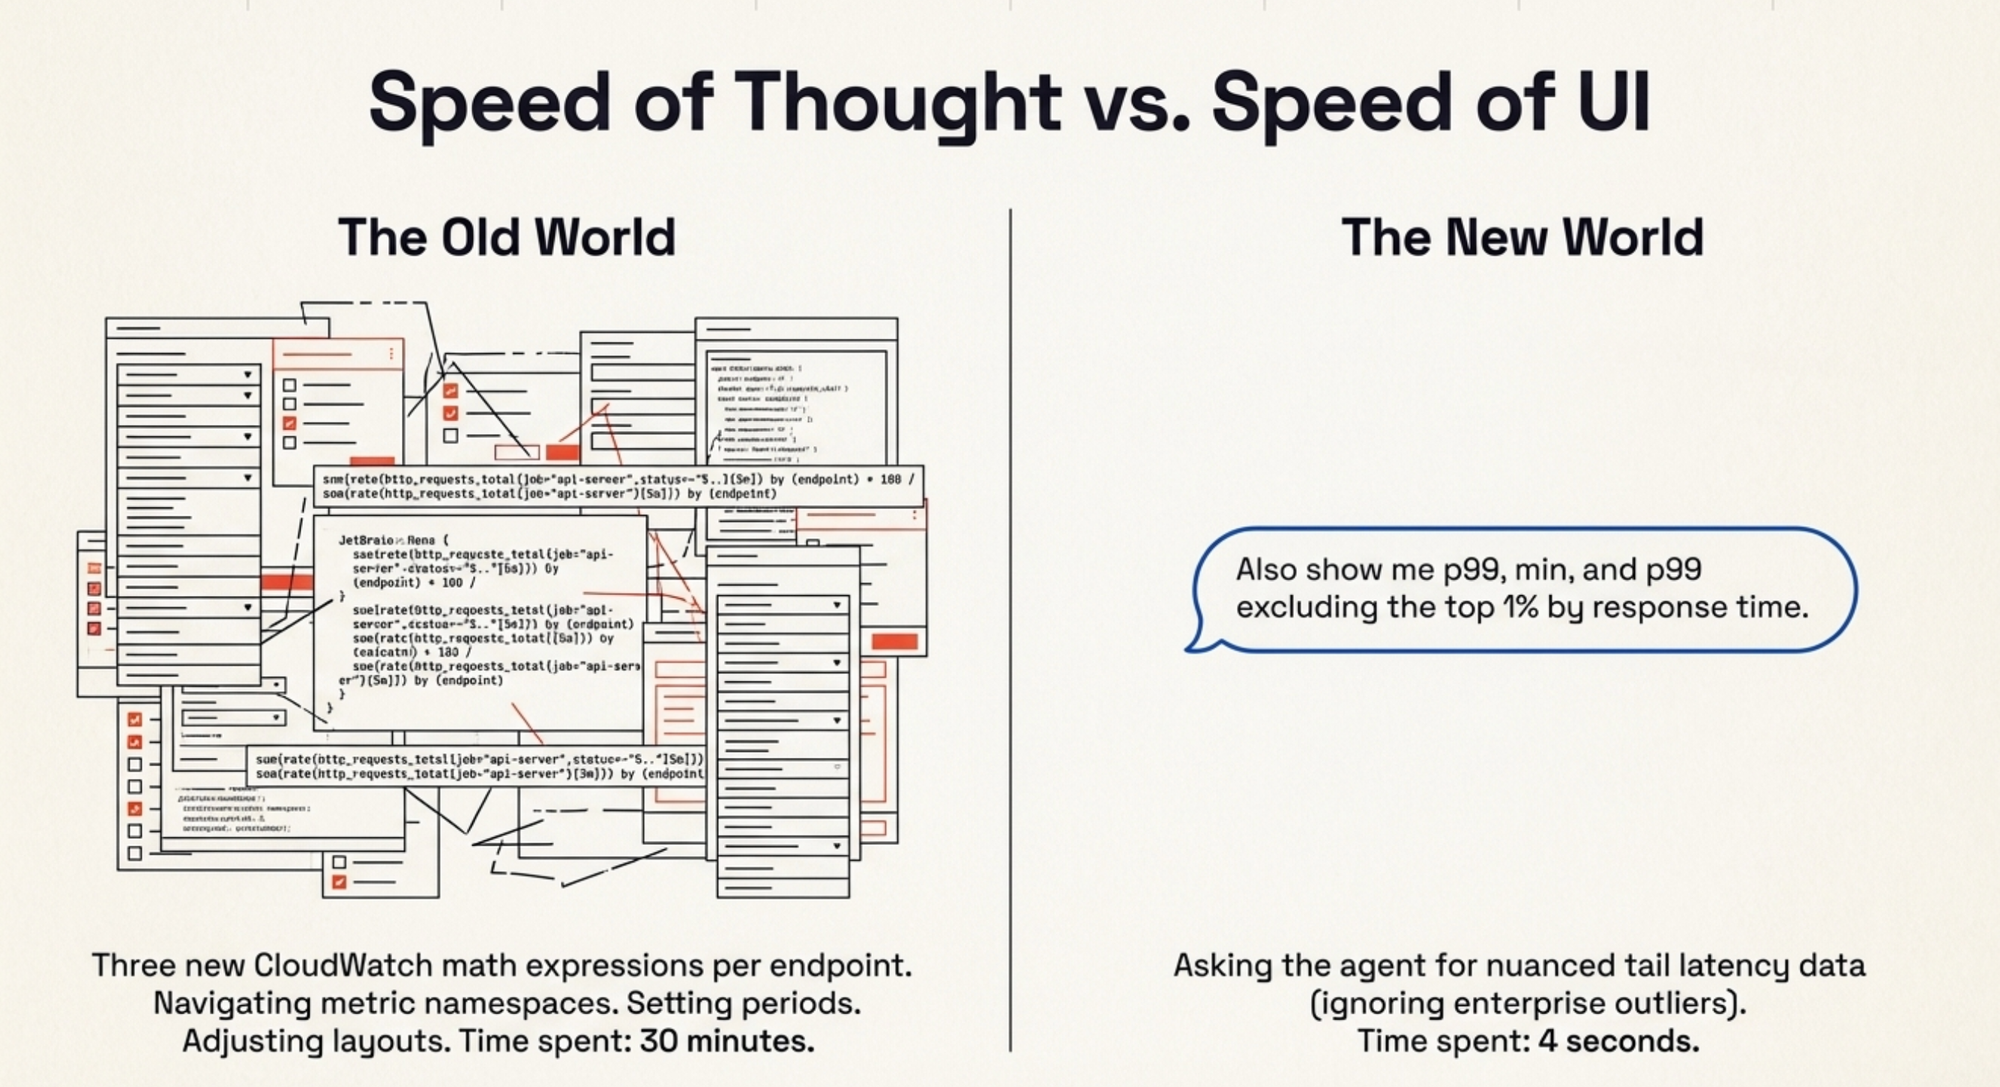
In the old world, realizing you need to monitor a new endpoint means: go to CloudWatch, create a new widget, configure the metric query, choose the statistic, set the period, adjust the dashboard layout, save, go back to actually fixing the problem you were investigating. Minimum ten minutes if you know CloudWatch well. Twenty if you need to look up the metric namespace.
In the new world: "Add /v1/users/export to the watch list." Done. The agent is already monitoring it. Time spent: four seconds and the calories required to type one sentence.
But it got better. After the initial monitoring period, I realized I wanted more nuanced latency data. The default was p50 and p95. For a caching change, I wanted to see p99 — because cache misses affect tail latency disproportionately. I also wanted to see the minimum, because a suspiciously low minimum might indicate an endpoint short-circuiting before it reaches the email module. And I wanted p99 excluding outliers, because we have a handful of enterprise customers whose requests legitimately take longer due to data volume, and they skew the tail.
Old world: three new CloudWatch math expressions per endpoint. A metric query language that reads like someone described SQL to a Perl enthusiast over a bad phone connection. Thirty minutes of work, minimum.
New world: "Also show me p99, min, and p99 excluding the top 1% by response time." The agent updated its own reporting. Next refresh, the new columns were there.
And here is the part that still surprises me, even after weeks of working this way: I told the agent to update the skill itself. Not just the current monitoring session — the skill definition. "Update the skill so that p99, min, and p99-excluding-outliers are included by default for future runs." The agent modified its own instructions. The next time anyone on my team runs /monitor-release, those statistics are there from the start. Nobody needs to ask for them. Nobody needs to know that I once spent an afternoon discovering they were important. The skill absorbed the lesson.
The Artifact That Learns
This is the insight that I keep coming back to: the skill is not a throwaway. It is an artifact that accumulates operational wisdom.
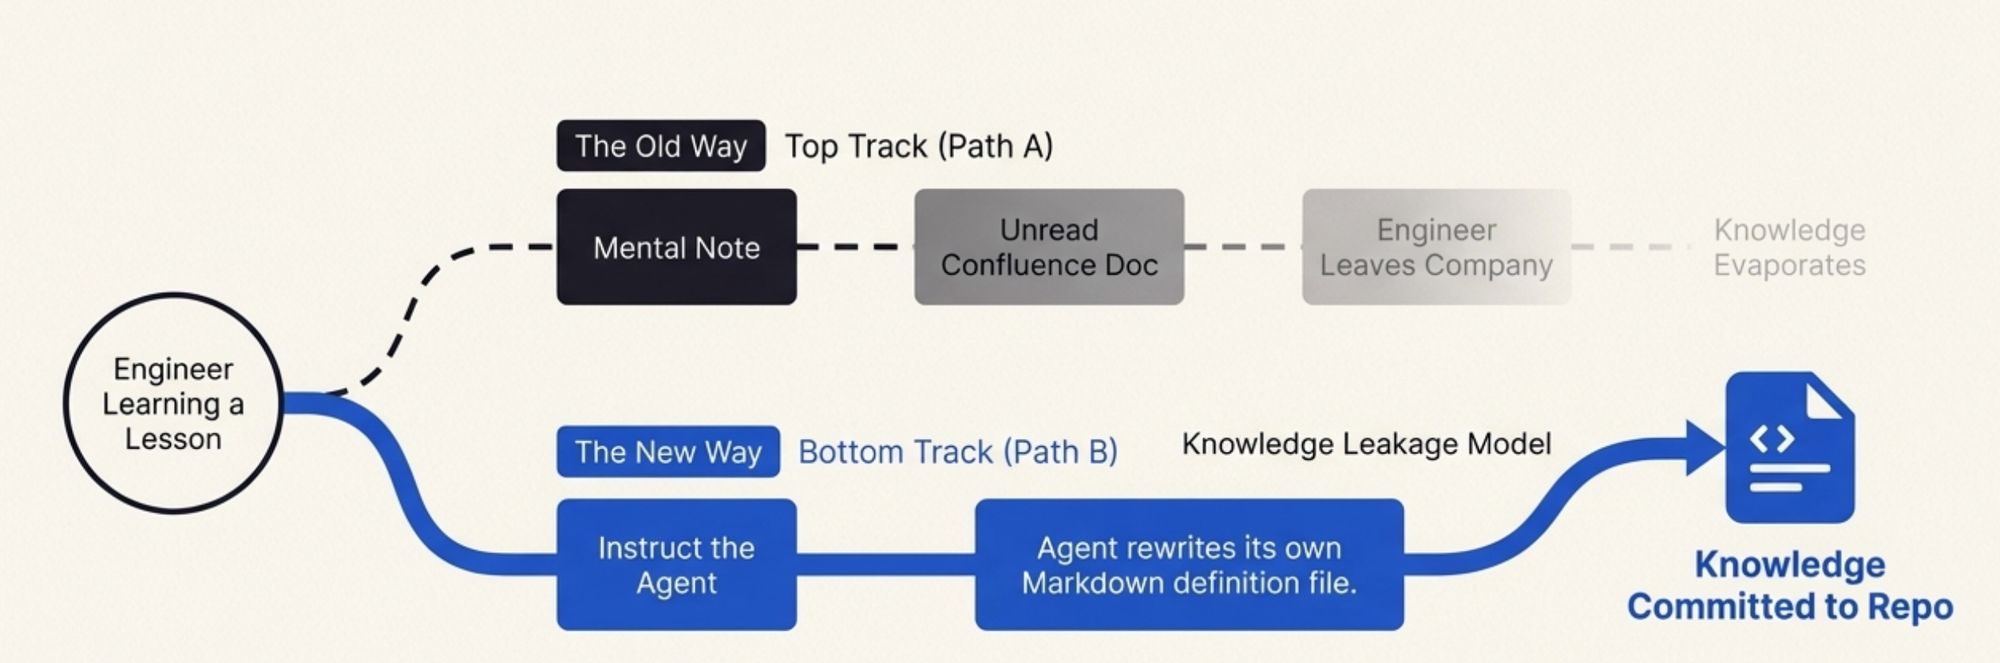
A monitoring script, once written, is frozen. It reflects the understanding of one engineer at one point in time. When you learn something during a release — this endpoint matters, that metric is noise, this threshold is too sensitive — you can update the script, but honestly, most people do not. They make a mental note, handle it manually next time, and eventually leave the company, taking the knowledge with them. The script stays frozen. Some new person runs it, gets incomplete data, and the cycle repeats.
The skill has a different lifecycle. Every time you use it, you can teach it. "Hey, also watch for connection pool exhaustion — that bit us last time." The agent updates the skill. "Ignore 404 spikes on /v1/health during deployments, those are expected." The agent adds the exception. The skill becomes the team's collective memory of what matters during a release, encoded in a format that is both human-readable and machine-executable.
When our rollout was done — caching layer verified, bug fixed, deprecated endpoint patched, incident report filed — I committed the skill to the repository. It is a Markdown file with tool definitions and monitoring instructions. A new engineer can read it and understand what the team watches during a performance release and why. They can also just run it and get the monitoring out of the box, without understanding every decision baked into it.
Compare this to the old world. After a release, you have: a CloudWatch dashboard that is already half-stale, a bash script that works on your machine, an incident report in Confluence that nobody will read, and tribal knowledge distributed across Slack threads. The new engineer joins, asks "how do we monitor releases?" and gets a shrug and a link to a dashboard from two quarters ago.
Now they get a skill. They run it. It works. And when they learn something new during their own release, they teach it to the skill, and the next person benefits.
What I Actually Believe Now
I want to be careful here because I have been in this industry long enough to know that "everything is different now" is almost always wrong, and the few times it is right, it is right in ways nobody predicted.
The AI skill did not replace monitoring. I still have CloudWatch. I still have Grafana. The metrics pipeline did not change. What changed is the interface between me and my monitoring — and the lifecycle of the operational knowledge I accumulate while using it.
That turns out to matter enormously.
The traditional development lifecycle has these discrete, painful handoffs: you plan, you build the monitoring, you deploy, you discover the monitoring is incomplete, you fix the monitoring, you discover problems, you fix the problems, you update the monitoring again, you write the incident report, you file the tickets, and then you move on and the monitoring rots. Every phase is a separate activity with its own tools and its own friction.
The skill collapses all of that into a continuous conversation. Pre-release, you describe what you want to watch. During the release, you adjust in real time by talking. Post-release, you commit the skill and the adjustments are preserved. The monitoring, the incident investigation, the knowledge capture — they are the same activity now. You do not context-switch between "monitoring" and "incident response" and "documentation." You just keep talking to the agent, and the skill absorbs everything.
Is this a paradigm shift? I am not sure I care about the label. What I know is that I spent roughly two hours on monitoring for this release, and in my previous comparable release without the skill, I spent closer to two days. I know that the monitoring coverage was better — the skill caught an endpoint I would have missed. I know that the artifact I committed is more useful to my team than any dashboard I have ever built. And I know that next time, the skill will be better than it was this time, because it learned from this release, and it will learn from the next one too.
The best tools are the ones that get smarter as you use them. For the first time in my career, my monitoring setup qualifies.
I am still going to keep the CloudWatch dashboards, though. We'll be accumulating the really critical metrics there, and someone needs something to screenshot for the incident channel. Some paradigms shift. Some just get a better co-pilot.